MvoPlus Sample Screen 2
MVO Mode
Description
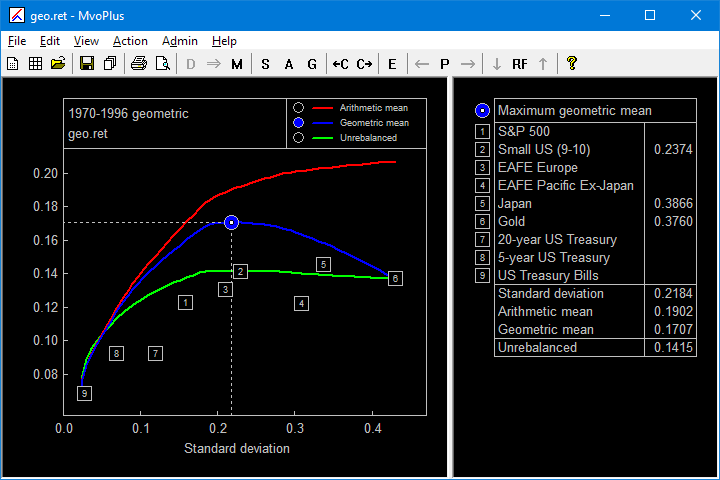
This example uses the same data set as Sample 1, except that it was generated using only:
The full set of historical data was not used. Nevertheless, the output here is very similar to that of Sample 1 (use the back and forward buttons on your browser to verify this).
This validation with historical data is very important, because it means that if you make predictions of the above quantities for some period in the future, and these predictions turn out to be correct, then it is reasonable to expect that the frontier plot generated by MvoPlus before-the-fact will turn out to be in good agreement with the corresponding plot constructed after-the-fact using the actual data.
This in turn means that it would have been possible for you, based on your beliefs about the future, to have selected a portfolio that would out-perform all of the individual assets.